Example usage
To use single_mol in a project:
import single_mol
import msions.utils as msutils
Define files
elib_file = "../panoramaweb_files/plasma-EV-01.mzML.elib"
mzml_file = "../panoramaweb_files/plasma-EV-01.mzML"
hk_file = "../panoramaweb_files/plasma-EV-01_MS1_3sn.hk"
kro_file = "../panoramaweb_files/plasma-EV-01_MS1_3sn.kro"
Figure 2a
fig2a will create the Figure 2a heatmap using the mzML and binning provided as arguments.
# create bins for m/z
mz_bin_size = 4
mz_bin_mult = 1.0005
mz_start = 399
mz_end = 1005

bin_mz_list = msutils.bin_list(mz_start, mz_end, mz_bin_size, mz_bin_mult)

# create bins for retention time
rt_bin_size = 0.25
rt_bin_mult = 1
rt_start = 0
rt_end = 100

bin_rt_list = msutils.bin_list(rt_start, rt_end, rt_bin_size, rt_bin_mult)
# plot figure 2a heatmap
# expect 1 min 36 sec
single_mol.fig2a(mzml_file, bin_rt_list, bin_mz_list, manu_mzml=True)
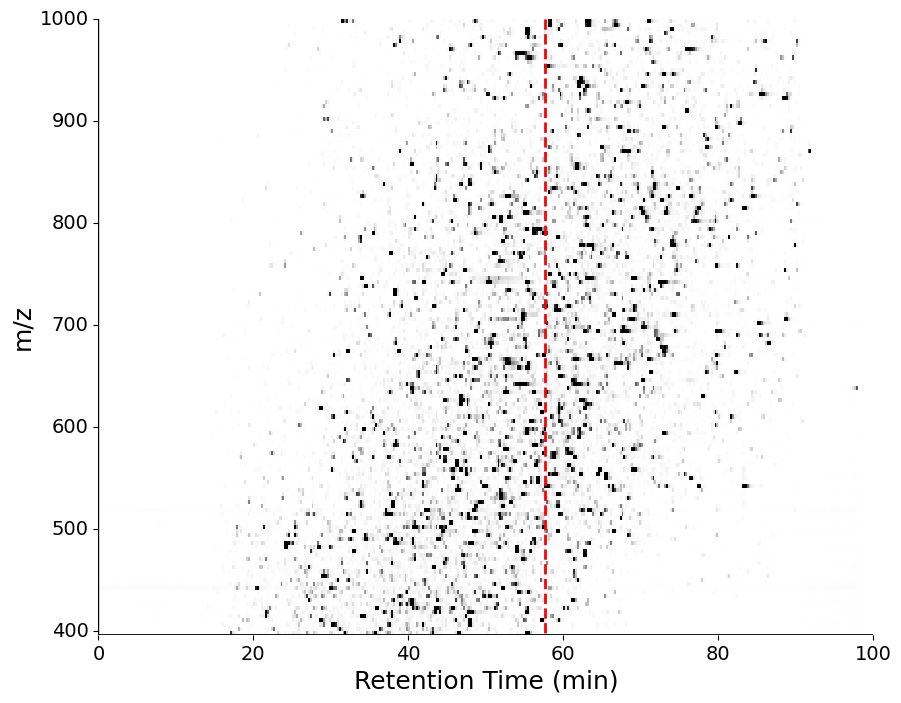
Figure 2a insert
fig2a_insert will create the Figure 2a histogram insert from a Kronik file and EncyclopeDIA elib.
# plot figure 2a histogram insert
# expect 6 min 7 sec
single_mol.fig2a_insert(kro_file, elib_file)
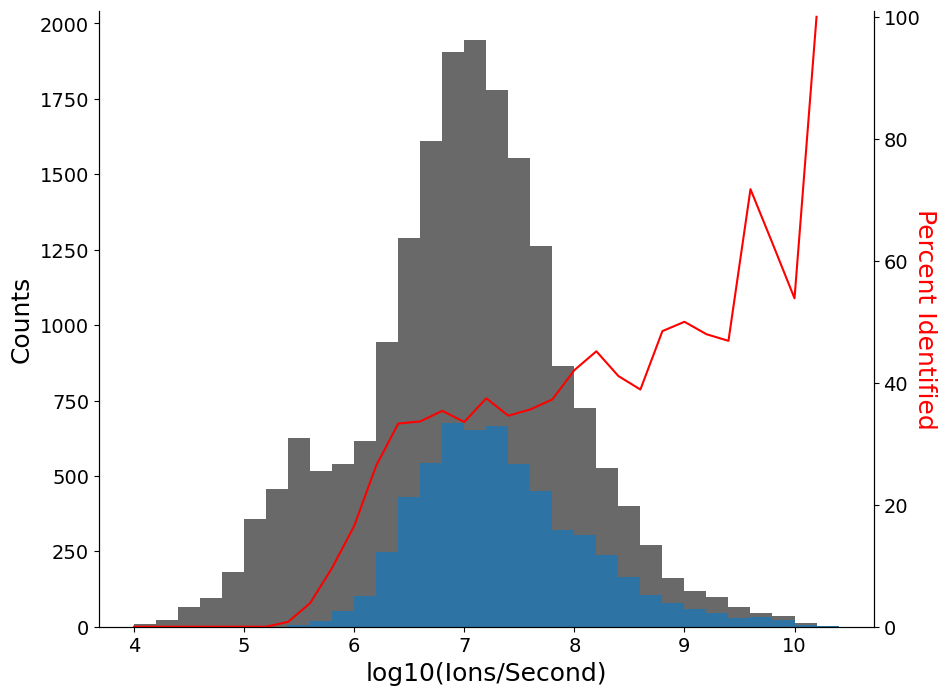
Figure 2b
fig2b will plot the identified and unidentified peaks from an MS1 scan and print the labels for the peaks.
# plot figure 2b MS1 peaks
# expect 3 min 29 s
single_mol.fig2b(mzml_file, hk_file, elib_file, scan_num=170933, id_peaks=7)
791.9327 m/z: IQPSGGTNINEALLR (sp|P19823|ITIH2_HUMAN)
545.3016 m/z: LLADPTGAFGK (sp|P30044|PRDX5_HUMAN)
545.3016 m/z: LDAQASFLPK (sp|P19827|ITIH1_HUMAN)
722.3533 m/z: LMQCLPNPEDVK (sp|P04003|C4BPA_HUMAN)
955.4457 m/z: LLATLCSAEVCQCAEGK (sp|P0C0L4|CO4A_HUMAN)
955.4457 m/z: LLATLCSAEVCQCAEGK (sp|P0C0L5|CO4B_HUMAN)
502.2885 m/z: QVVAGLNFR (sp|P01042|KNG1_HUMAN)
671.3362 m/z: TFGSGEADCGLRPLFEKK (sp|P00734|THRB_HUMAN)
437.2456 m/z: GIWLEAGK (sp|Q9Y490|TLN1_HUMAN)
437.2456 m/z: GLQVLMGR (sp|Q7L576|CYFP1_HUMAN)
437.2456 m/z: GLQVLMGR (sp|Q96F07|CYFP2_HUMAN)
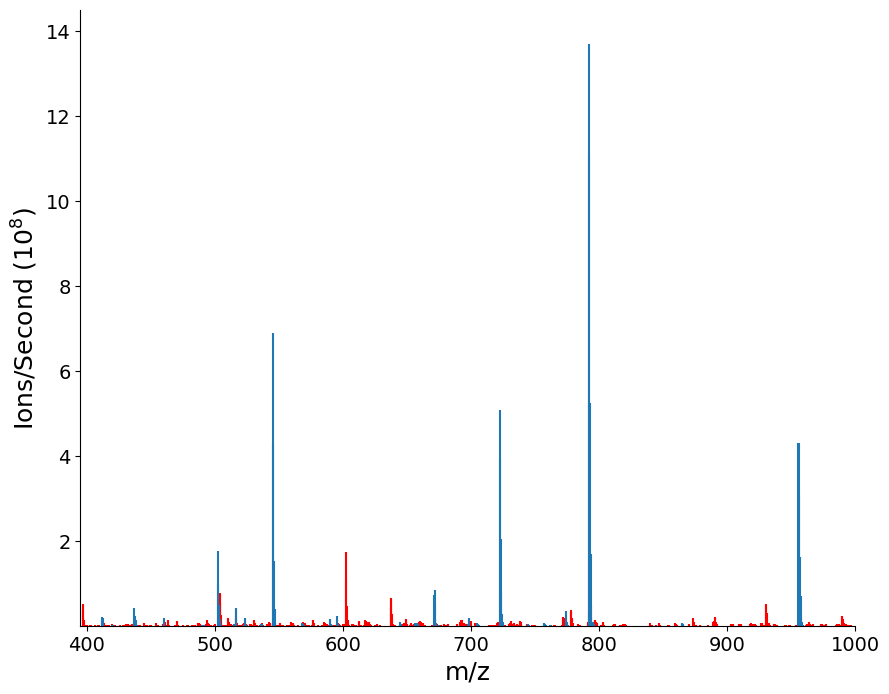
Figure 2c
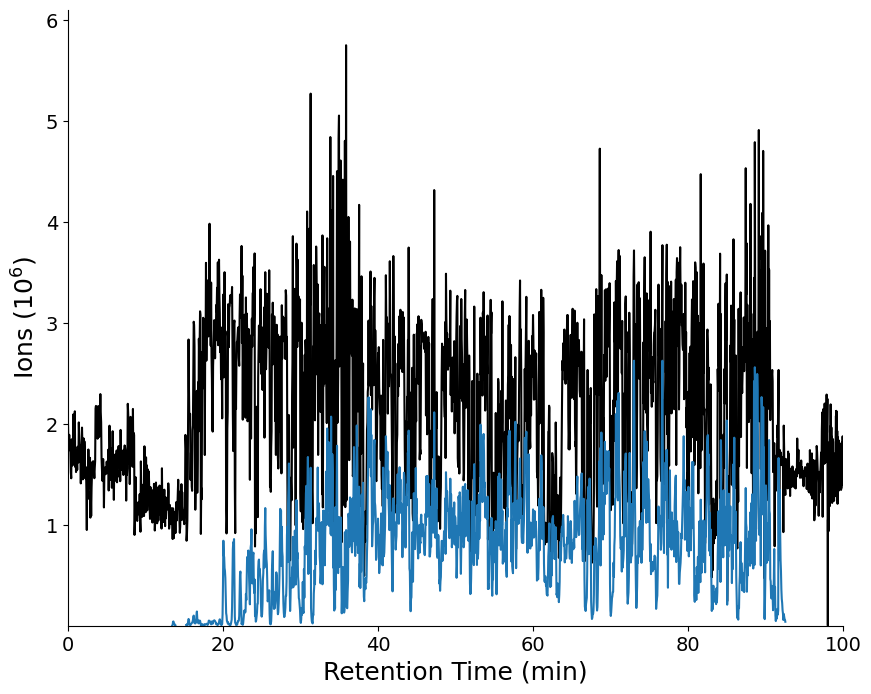
fig2c will plot the Total Ion Current (TIC) and identified ion current.
# plot figure 2c TIC
# expect 4 min 42 sec
single_mol.fig2c(mzml_file, hk_file, elib_file)
Total Ion Current (TIC): 10523443416667
ID'd TIC: 4883887856314
46.4% of the signal
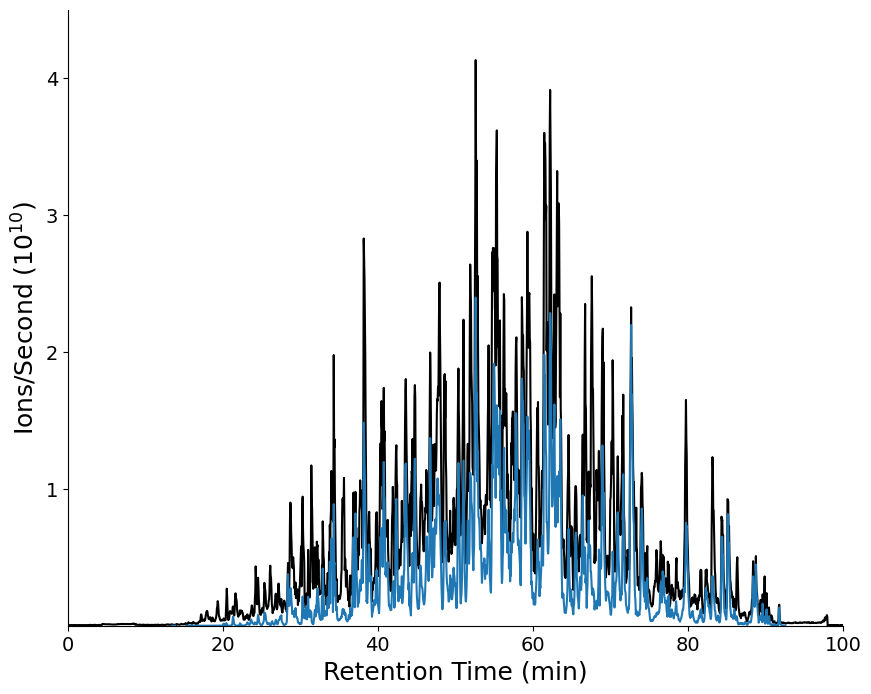
Figure 2d
fig2d will plot the total ions and identified ions.
# plot figure 2d ions
# expect 4 min 42 sec
single_mol.fig2d(mzml_file, hk_file, elib_file)
Total # of ions: 5057320877
Ions mapped to peptides: 1222192892
24.2% of the signal